Rust UEFI Runtime Driver
October 8, 2020
Introduction
In the last few months I’ve started working with Rust in the UEFI world, in order to write a hypervisor as a UEFI runtime driver for educational purposes.
At first, I evaluated uefi-rs as a wrapper between UEFI interfaces and Rust. According to the developers, its main goal is to “to provide safe and performant wrappers for UEFI interfaces, and allow developers to write idiomatic Rust code”. Philipp Oppermann, the author of “Writing an OS in Rust”, uses the library for example to create an experimental x86 UEFI bootloader.
Unfortunately, I’ve quickly ran into the first problems, since the library in its current state does not cover all the interfaces and functionality needed for my purposes. As a result, I’ve decided to use r-efi, which provides all protocol constants and definitions of the UEFI Reference Specification without any safe wrappers implemented in Rust.
Features
Today I’ve written down my insights over the past months and created a GitHub repository, which serves as a foundation for UEFI runtime driver development in Rust. Its equipped with various useful features for developing and prototyping and aims to help getting started.
Cargo configuration
Before the release of nightly 2020–07–15, using cargo xbuild was the recommended way to cross compile the sysroot crates core, compiler_builtins and alloc for custom targets. Fortunately, Cargo by now supports build-std and as a result is able to cross compile the sysroot without any extra tools. Furthermore, we can remove rlibc as a dependency, since nightly 2020-09-30 allows to use compiler_builtins mem feature to provide the implementations of memset, memcpy, etc.
We can activate both of these features by creating a .cargo/config.toml in our project root file containing:
[build]
target = "x86_64-unknown-uefi"
rustflags = ["-Z", "pre-link-args=/subsystem:efi_runtime_driver"]

[unstable]
build-std = ["core", "compiler_builtins", "alloc"]
build-std-features = ["compiler-builtins-mem"]
Furthermore, we set our build target to be x86_64-unknown-uefi and provide an additional argument to the linker, in order to create a UEFI runtime driver instead of an UEFI application.
Serial port logging
Using UEFIs Simple Text Output Protocol for logging is only viable for UEFI applications which operate before ExitBootServices() is called. Since we want our logger to work even after the boot services are not safe to call anymore, the custom logger writes to a serial port (COM1, 0x3F8) instead. As a result, we are able to use our logging macros such as debug! and info! even after the operating system is loaded.
Setup
Building
Compiling our template project is as simple as building any other Rust project.
$ cargo build
Finished dev [unoptimized + debuginfo] target(s) in 0.02s
$ file target/x86_64-unknown-uefi/debug/rust-efi-runtime-driver.efi
target/x86_64-unknown-uefi/debug/rust-efi-runtime-driver.efi: PE32+ executable (EFI runtime driver) x86-64, for MS Windows
As intended, we’ve successfully built a PE32+ executable containing a EFI runtime driver.
VMware
With the driver ready to go, we will update the VMware configuration of our guest machine to allow for proper debugging.
To do so, we append the following to our .vmx configuration file.
debugStub.listen.guest64 = "TRUE"
debugStub.listen.guest64.remote = "TRUE"
debugStub.hideBreakpoints = "1"
The GDB-based guest debug stub while now await connections (local and remote) on port 8864.
In the repository, a create_disk.sh script is provided to automatically create a .vmdk (Virtual Machine Disk) file containing the driver, which can then be mounted by the guest machine.
To now load the runtime driver, we select Power On to firmware, boot into an EFI shell and use the load command to load the driver.
Beware: If you built the driver as a debug build, loading the driver will freeze the machine until a debugger connects and breaks the waiting loop.
Windows
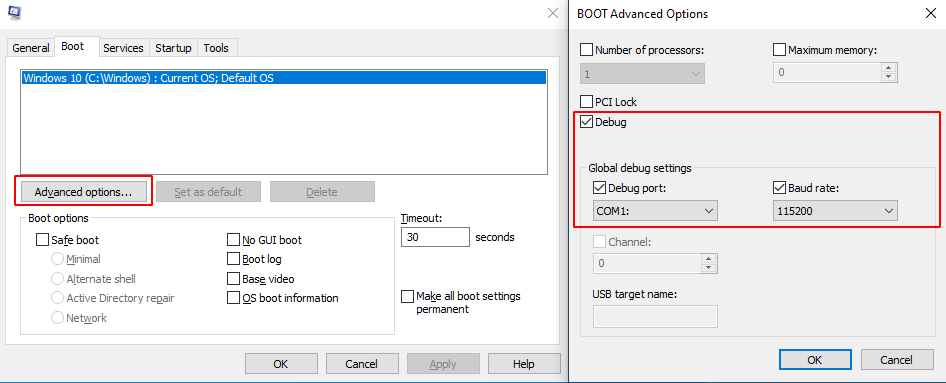
Receiving serial port output for logging is incredibly useful, especially during the runtime of the operating system. In order to receive the serial port output on Windows after ntoskrnl has been initialized, we need to activate the Debug mode on our test machine by executing msconfig as shown below and rebooting the machine afterwards.

Windows Advanced Boot Options
GDB & CLion
By today’s standards, debugging with GDB on the command line is not as convenient as source-level debuggers in IDEs such as Visual Studio or CLion. Luckily, we can make use of CLions GDB Remote Debug feature to debug our runtime driver and therefore be able to use advanced debugging features such as conditional breakpoints, Rust language support and built-in visualizers (strings, vectors and other standard types).

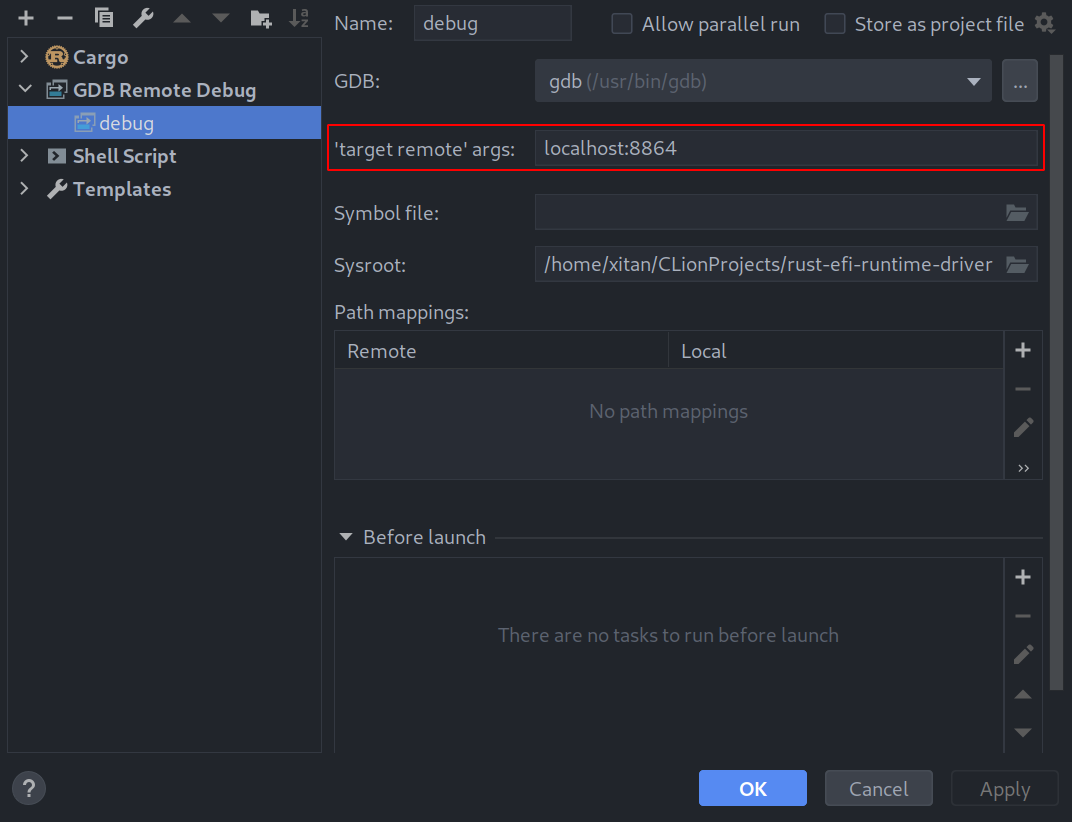
CLion Debug Configuration
By creating a new debug configuration we can specify a remote target, containing the address of the host machine as well as the previously mentioned port 8864.
An additional step is needed to enable GDB to load the debug symbols of our runtime driver. At this point, the driver is already loaded in memory and stuck in the debug waiting loop. While GDB can load the debug symbols of our PE file out-of-the-box, it lacks information on where the respective sections are mapped in memory. The following code snippet is part of the load-symbols.py script I’ve provided in the repository.
argv = gdb.string_to_argv(args)

# Parse arguments.
address = get_number(argv[0])
path = get_string(argv[1])
print(f'{path}: {address:02x}')

# Find the base address of the PE.
base_address = address & 0xfffffffffffff000
while get_number('*(unsigned int *){}'.format(base_address)) != pe_magic:
    base_address -= 0x1000

# Print base address.
print(f'Base ({path}): {base_address:02x}')

# Parse PE.
sections = {}
pe = pefile.PE(path)
for section in pe.sections:
    name = section.Name.decode().rstrip('\x00')
    address = section.VirtualAddress + base_address
    if name[0] != '/':
        print(f'Section: {name}: {address:02x}')
        sections[name] = address

# Remove previous symbol file.
try:
    gdb.execute('remove-symbol-file {path}'.format(path=path))
except Exception as _error:
    pass

# Add the symbol file.
gdb.execute('add-symbol-file {path} {textaddr} -s {sections}'.format(
    path=path, textaddr=sections['.text'],
    sections=' -s '.join(
        ' '.join((name, str(address))) for name, address in sections.items() if name != '.text')
))
The approach is to take the current rip and iterate backwards until we find the PE file signature at the beginning of our driver. This works, since the rip currently points to the instructions of our waiting loop within the .text section. We parse the PE binary to recover the virtual addresses of the sections and add them to the previously calculated base address. The created mapping is then fed back into GDB to make use of the contained debugging information and allow for source-level debugging.
We create a custom GDB command called dbg to combine the needed commands into a single command. By storing the command in a file named .gdbinit at the root folder of the project, GDB is able to automatically import our new command during startup.
define dbg
  source ./load-symbols.py
  file
  load-symbols $rip "./target/x86_64-unknown-uefi/debug/rust-efi-runtime-driver.efi"
  set GDB_ATTACHED = 1
end
Notice how the command sets the the variable GDB_ATTACHED to 1 after loading the symbols, in order to break the waiting loop the driver is currently stuck in.
Debugger Showcase
Future Work
In the next weeks, I plan to finally polish my UEFI runtime driver + user mode library, which allows to read and write virtual and physical memory as well as execute kernel code from user mode. Eventually, I also hope to finish and release my UEFI hypervisor together with a user mode library comprising various Virtual Machine Introspection (VMI) related features. Both projects showcase various UEFI-related characteristics and features such as memory allocations in combination with Rust or UEFIs multi-processor protocol.